Personal Projects: Engineering
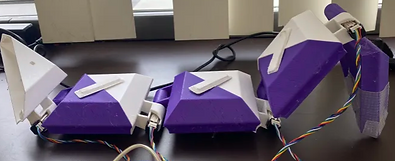
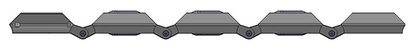
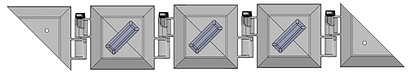
My role was centered around prototyping the geometric design of the robot's modules and aiding in component selection. This process started as we brainstormed by folding paper models, then made CADs, 3D printed, and tested individual modules. The design was continually adjusted (an example being V1 and V2 shown to the right) alongside changes to our selected electronic components like motors, the addition of new folding configurations. This, alongside researching lightweight batteries (which were ultimately lithium polymer), was also geared towards minimizing the robot's mass to facilitate folding.
Origami Transformer Bot
(Senior MechE Capstone Project)
Goal: Create an origami-inspired robot with ability to transform into multiple configurations and achieve locomotion, within $600 budget. Achieve easy storage, easy reconfiguration, battery power, and internalized electronics. Potential applications include space optimization and accessibility as well as search and rescue.
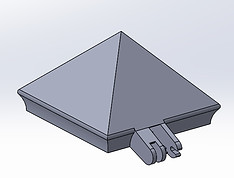
V1

V2

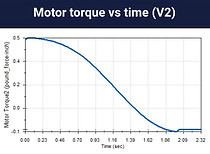


Our team selected used encoders to achieve positional control, and a large part of the electronics was testing motors based on cost, torque, and RPM for folding at the robot's joints. We also implemented PID control to minimize and overshoot (smoother folding).
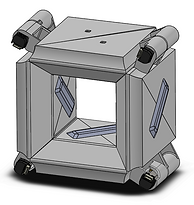
Results: Robot could fold into 3 configurations (cube, crab, and table) and also achieve inchworm-like locomotion. Most electronics weren't housed internally. Cube configuration shown as an example to the left. Wiring diagram below.


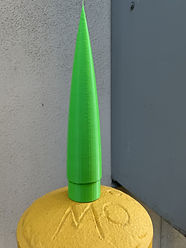
My team and I used OpenRocket and CAD to design all parts of the rocket aside from the motor and electronics. We adjusted the fin and body tube sizing to balance stability and mass/drag for optimizing the apogee.
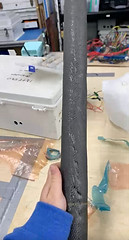
Then, we completed a carbon fiber layup, laser cutting, 3D printing, and machine shop fabrication for construction. Lastly, we designed the circuit and soldered electronics.
Results: Successful launch with ~2,800-foot apogee.
Mini Rocket Design & Fabrication
Goal: Launch a high-power rocket with stability in range 1.10 - 2.50, maximum weight of 3 ounces, and minimum speed of 15 m/s at the top of the launch rail. Obtain highest apogee possible and eject a parachute for optimal landing and recovery.


Path-Following Robot
Goal: Implement PID control scheme on a robot car so that it senses and follows a curved path with an initial offset. Ensure that it turns around 180° at the end and returns to the starting point, with a bonus if it does so in 12 seconds.
I completed the PID Arduino program, then tuned and debugged the code to find the error (distance between the car and the black path’s centers). This first required calibrated the car’s sensors and executing sensor fusion by manipulating IR sensor data in Excel and applying a weighting scheme. In total, I ran over 200 tests by varying duty cycle/base motor speed, wheel directions, variable constants, battery voltage, and ambient lighting.
Results: Robot followed the path and achieved the bonus by finishing the track in 11.2 seconds.
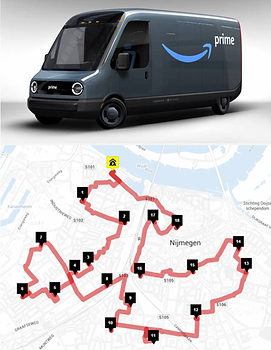
Route Optimization for Electric Delivery Vehicles
Goal: Develop a proposal for a system that adds a charging station stop to an electric delivery vehicle (EDV) shipping route while maximizing energy and time efficiency -- route optimization. More specifically, minimize the distance traveled for a charging station detour and minimize charging time and wait time at the station.
For context, my partner and I were to incorporate RFID, NFC, and/or IOT technology as a solution to a current real-world engineering problem. We knew that shipping/delivery companies like Amazon and UPS and others are dealing with transitioning their delivery fleets to all-electric.
We assessed Amazon's Rivian EDVs (pictured above) that may require charging to be factored into a driver’s daily route. My idea was that driver could tap with NFC on their mobile devices at an EV charger to augment and update charging queues. Other drivers could then have opportunity go to an alternate station with a shorter queue or consider taking a break during charging time.
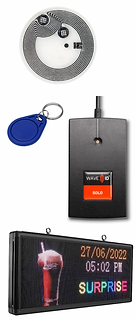
We built off of the infrastructure of Amazon’s alleged prior optimization app, Rabbit, a GPS/navigation system and shipment inventory log. Rabbit already measures GPS map data, time windows for deliveries, traffic, weather, construction, hazards). This data would be combined with new data taken from EV chargers (the length of the charging queue, queue order, time stamps of NFC taps, and location of station) as well as data from the driver’s own vehicle (battery level, driving range). This IOT network would enhance the Rabbit algorithm by determining the most optimal time and location to charge the EDV. Although we originally proposed RFID key fobs for tap technology, we shifted to NFC to reduce hardware (pictured to the right) and made RFID key fobs an optional addition.

Results:
We designed an overall system where Rabbit remains a central platform that will compile and analyze data.
To the left is my schematic of the process at the charging station. A central RFID reader that the driver first taps their mobile NFC onto to join the queue is placed at the station. Then, Rabbit displays the driver’s position number in the queue. Through middleware, a central reader transmits the queue onto a digital screen above it that displays a randomized number generated for the user -- like numbers displayed at a restaurant to show the status of an order. The display exists since non-delivery drivers don’t have access to Rabbit while charging.
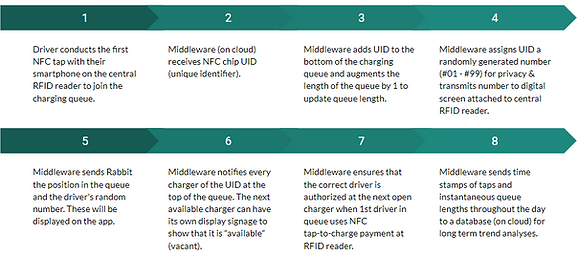
There is also an RFID reader connected to each individual charger so that the first driver in the queue can tap again to claim the open charger. The data for the NFC UID at the top of the queue will be transmitted from the central reader to the middleware. Hence, during full capacity, the next available charger will know what tag to expect next and authorize. A timer is embedded within the middleware, so if the first person in the queue does not claim the open charger within 5 minutes, the charger is assigned to the next spot in the queue. The role of middleware is explained in the flow chart to the right.
We assessed Amazon's costs for software implementation to be about $1.5 million, and charging companies or other entities would cover separate hardware costs; we found that this model could be profitable for involved parties after 4 months.
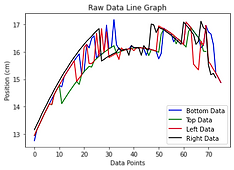
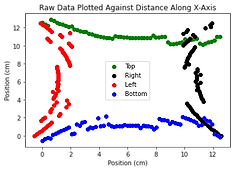
We sent sound waves to each of 4 sides (top, bottom, left, right) of the object's cross- section. The sensor’s receiver found the time taken for the sound wave return after reflection.
Our analysis was as follows. As shown on the schematic to the right, with trigonometry, we calculated the “vertical distance” to the object. Then, as shown in the plots below, we graphed the distance against an x-axis position, measured in centimeters. We used a function to obtain a trapezoidal approximation of the data's integrals. We also obtained a fit of each data set, shown last, and took their definite integrals for another approximation of the cross-sectional area of the object.
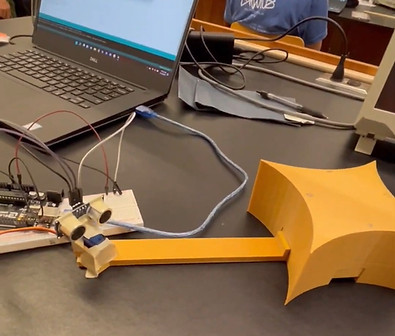
RADAR Mapping
Goal: Use an Arduino and an ultrasonic sensor's RADAR capabilities to map out the cross-section of a known 3D-printed object. Validate the object's cross-sectional area.
Me and my partner's experiment captured how a sound wave can be transmitted by our ultrasonic sensor, reflected off of a surface, and detected by the sensor again. The sensor was mounted on a rotating servo motor and swept across the face of our chosen object -- a 3D-printed “sparkle” shape. The sensor & servo were wired to our circuit to communicate with the Arduino.


Results: The expected cross-sectional area from CAD was 88.2373 sq cm; the trapezoidal approximation yielded a value of 73.3548 and the definite integral yielded a value of 69.4531. The first plot shows that the further the surface is from the sensor, the more error there is in the readings (see dips in values at the middle of the parabolic trend). With this in mind, the 16.9% error in the trapezoidal approximation was reasonable enough for our validation purposes.
